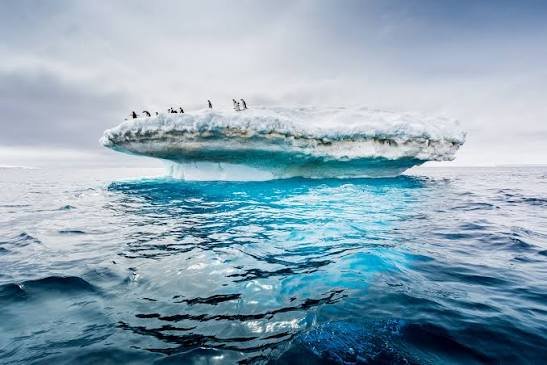








For millions of people, the word “clima” is simply part of a daily question: Will it be hot today? Will rain arrive this week? Is the next season likely to be warmer or wetter than normal? But behind that everyday word is a much larger story. The world’s climate system is changing, and the latest scientific observations show that the shift is no longer something discussed only in long-term forecasts.
The World Meteorological Organization confirmed in March 2026 that 2015 through 2025 were the 11 hottest years in the instrumental record. It also reported that 2025 was the second- or third-warmest year ever recorded, at about 1.43°C above the 1850–1900 average.
That does not mean every day or every city is getting hotter. Weather still changes constantly, and individual regions can experience unusually cold periods. What matters is the longer pattern: temperatures, oceans, glaciers, sea levels, rainfall and extreme events are changing together.
What Clima Actually Means
In Spanish and Portuguese, “clima” generally translates to “climate,” although everyday speakers can sometimes use it when discussing weather conditions. The distinction between weather and climate is important. Weather describes atmospheric conditions over short periods, such as today’s temperature, tomorrow’s rain or a weekend storm. Climate describes longer-term patterns and averages that develop over decades.
Scientists therefore do not determine climate from a single hot afternoon or one unusually cold winter. Instead, they examine large datasets covering temperature, precipitation, atmospheric composition, ocean conditions, ice and other indicators. The World Meteorological Organization uses multiple independent datasets to monitor global conditions, helping scientists identify whether a particular event is part of a broader trend rather than an isolated fluctuation.
Why the Latest Climate News Matters
The latest global observations provide a clear reason to pay attention. WMO’s State of the Global Climate 2025 report found that Earth’s energy imbalance reached a new high in the observed record. The ocean also reached record levels of heat content in 2025, while glaciers continued losing mass and Arctic sea ice remained near historically low levels.
The significance goes beyond a number on a temperature chart. Warmer oceans influence marine ecosystems, evaporation and atmospheric moisture, while changing temperatures can affect agriculture, water availability and human health. Extreme heat can place additional pressure on electricity systems and cities, while heavy rainfall can overwhelm drainage infrastructure. Climate conditions therefore increasingly influence decisions made by governments, businesses, farmers and households.
2025 Was Another Major Warning Sign
One of the strongest recent developments is the confirmation that the exceptional warmth of the early 2020s continued into 2025. WMO’s consolidated analysis placed the global average surface temperature in 2025 at approximately 1.44°C above the 1850–1900 baseline, with an uncertainty range of ±0.13°C. Different datasets ranked the year either second or third, but they agreed on the broader message: 2025 was among the warmest years ever observed.
The longer sequence is even more significant. According to WMO, the years from 2015 through 2025 were the 11 warmest on record. That does not mean temperatures rise by exactly the same amount every year. Natural influences such as El Niño and La Niña can temporarily push global temperatures higher or lower. However, those short-term swings occur on top of a long-term warming trend driven primarily by increasing concentrations of heat-trapping greenhouse gases.
What 2026 Is Showing So Far
Early 2026 data demonstrate why scientists continue to monitor the climate month by month. Copernicus reported that January 2026 was the fifth-warmest January globally in its ERA5 record, with an average surface air temperature of 12.95°C. It was 0.51°C above the 1991–2020 January average and approximately 1.47°C above the estimated 1850–1900 pre-industrial level.
February continued the pattern without setting a new monthly record. Copernicus calculated that February 2026 was the fifth-warmest February globally, 0.53°C above its 1991–2020 average and about 1.49°C above the estimated pre-industrial level. March was the fourth-warmest March globally, while Europe experienced its second-warmest March in the Copernicus record.
These monthly rankings matter because they show that global warming does not produce identical conditions everywhere. In fact, February 2026 brought significant regional contrasts, with unusually warm conditions across parts of the Middle East, Central Asia and the United States while some northern regions experienced substantial cold. Climate change is therefore not simply a story of every location becoming uniformly warmer.
Weather Can Still Turn Surprisingly Cold
One common misunderstanding is that climate change should eliminate cold weather. That is not how the climate system works. A warming planet can still experience severe cold spells because atmospheric circulation, ocean temperatures, polar conditions and other factors can shift from one region to another.
Copernicus highlighted this contrast in January 2026, when large parts of North America, Europe and Siberia experienced severe cold during the second half of the month. A more wavy-than-usual polar jet stream helped allow very cold Arctic air to move into the middle latitudes. At the same time, the global average remained unusually warm.
This is why climate science relies on large-scale datasets rather than isolated experiences. Someone experiencing an unusually cold week is not contradicting evidence of global warming. Both observations can happen simultaneously because weather describes short-term conditions, while climate describes the statistical behavior of the system over much longer periods.
The Ocean Has Become a Critical Climate Indicator
Land temperatures attract most headlines, but the ocean is one of the most important parts of the climate story. Water absorbs enormous quantities of heat, and WMO reported that ocean heat content reached a record high in 2025. The organization also noted that the ocean has absorbed an amount of energy equivalent to about 18 times annual human energy use each year over the past two decades.
Ocean warming has wide-ranging consequences. It can affect marine ecosystems, coral reefs, fisheries and sea levels, while warmer seawater can contribute additional energy and moisture to weather systems. The ocean also absorbs carbon dioxide from the atmosphere, creating another major climate connection. Scientists therefore track sea-surface temperature, deep-ocean heat content, ocean chemistry and sea-level changes alongside atmospheric temperature.
Greenhouse Gases Remain at the Center of the Story
The fundamental scientific explanation for modern global warming is the increasing concentration of greenhouse gases in the atmosphere. Carbon dioxide, methane and nitrous oxide trap heat that would otherwise escape into space. Human activities, particularly the burning of fossil fuels, land-use changes and industrial processes, have substantially increased these concentrations.
WMO’s 2025 climate assessment reported that concentrations of carbon dioxide, methane and nitrous oxide reached their highest levels in at least 800,000 years in 2024. The report listed atmospheric carbon dioxide at approximately 423.9 parts per million, methane at about 1,942 parts per billion and nitrous oxide at around 338 parts per billion.
NASA likewise describes the scientific evidence for warming as unequivocal and points to multiple independent indicators, including ice cores, tree rings, ocean sediments, coral records and modern temperature measurements. These different lines of evidence reinforce the conclusion that today’s warming is real and that human activity is the dominant driver of recent long-term warming.
Extreme Weather Is Becoming a Bigger Concern
Climate change does not create every individual storm, flood or heatwave. Instead, it can alter the background conditions in which extreme events develop. A warmer atmosphere can hold more water vapor, while higher temperatures can intensify heat stress. Changes in ocean temperatures and atmospheric circulation can also influence certain weather patterns.
WMO’s latest assessment found that extreme heat, heavy rainfall and tropical cyclones continued to cause significant disruption in 2025. The report emphasized that climate-related hazards can expose weaknesses in interconnected economies and infrastructure.
The practical implication is increasingly important: communities need both emissions reduction and adaptation. Better drainage, heat-warning systems, resilient infrastructure, improved water management and accurate forecasts can reduce risks even while governments work to reduce greenhouse-gas emissions.
Climate Change Is Affecting Europe Too
Europe provides a particularly visible example of how climate conditions can shift across an entire continent. The European State of the Climate 2025 report, released in April 2026 by ECMWF and WMO, described Europe as the fastest-warming continent and documented major heat, drought, wildfire and ice-related impacts.
The report said Europe experienced record heatwaves extending from the Arctic to the Mediterranean, record sea-surface temperatures and the largest wildfire-burned area in the available record. It also reported that 70% of rivers had below-average annual flows.
These developments demonstrate why the climate conversation is not limited to temperature alone. Water availability, wildfire risk, agriculture, biodiversity, energy demand and public health are all connected. A region can face several climate pressures at the same time, making adaptation planning increasingly important.
Why Climate Data Matters for Everyday Life
For ordinary people, climate statistics can seem distant until they affect practical decisions. Farmers depend on seasonal rainfall and temperature patterns. Cities need to plan for heat and flooding. Energy providers must prepare for changes in electricity demand during extreme temperatures. Travelers, insurers and businesses also use weather and climate information to manage risk.
The most useful approach is to distinguish between a weather forecast and a climate outlook. A forecast can help answer whether rain is likely tomorrow. Climate information can help explain whether a region typically has wet or dry seasons, how temperatures have changed over decades, and how future conditions may differ from historical averages.
That distinction can also make online searches more reliable. When people search “clima” or “climate,” they may be looking for today’s conditions, a seasonal forecast or information about long-term climate change. Those are different questions and require different datasets and time scales.
Technology Is Changing How We Monitor Climate
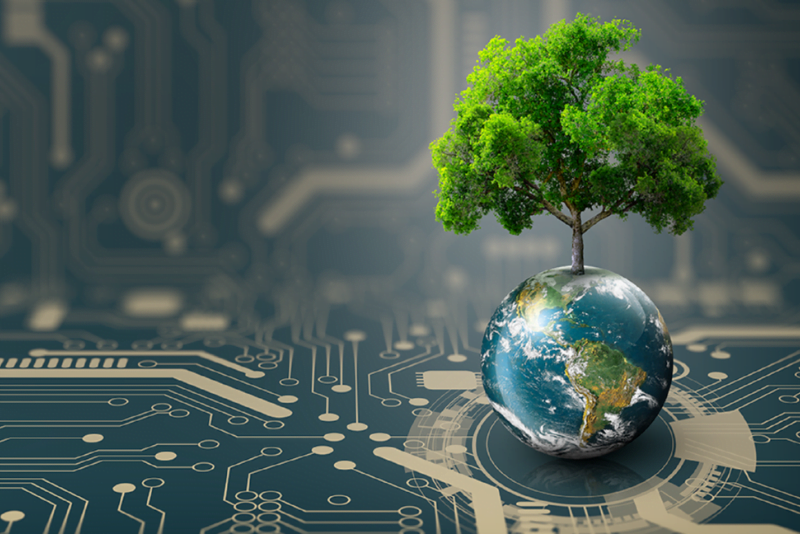
Modern climate monitoring depends on an enormous global observation network. Satellites, weather stations, ocean buoys, research ships, aircraft, weather balloons and remote sensing systems continuously collect information about Earth’s atmosphere, land and oceans. WMO has described these observations as the backbone of climate monitoring and early-warning systems.
NASA’s GISTEMP system, for example, combines observations from land meteorological stations and ocean measurements to estimate changes in global surface temperature. Its datasets are updated regularly as new observations arrive and earlier measurements are corrected or refined.
Artificial intelligence and advanced computing are also expected to play a growing role. Better models can process huge datasets, identify patterns and improve forecasting. However, technology does not replace observation. Reliable climate science still depends on high-quality measurements and transparent methods.
What the Future of Clima Could Look Like
The future depends heavily on how quickly greenhouse-gas emissions decline and how effectively societies adapt to unavoidable changes. Scientists do not expect the climate to return automatically to an earlier state simply because one or two years happen to be cooler. The atmospheric system responds to accumulated greenhouse gases over long periods.
That means the coming decades will likely involve two parallel efforts. The first is mitigation: reducing emissions through cleaner energy, greater efficiency, electrification and other measures. The second is adaptation: redesigning cities, agriculture, infrastructure and emergency systems for conditions that are already changing.
The encouraging part is that climate action can also create broader benefits. Cleaner energy can reduce air pollution, efficient buildings can lower energy costs, and better public transportation can reduce congestion as well as emissions. Climate resilience is therefore increasingly becoming an economic and public-health issue rather than only an environmental one.
What Readers Should Watch Next
The most important climate indicators to follow include global average temperature, ocean heat content, greenhouse-gas concentrations, sea level, glacier mass and Arctic and Antarctic sea ice. No single number tells the whole story. Scientists look at several indicators together to determine whether the underlying trend is changing.
For 2026 and beyond, monthly Copernicus updates and annual WMO assessments will remain especially useful because they place individual weather events into a broader statistical context. NASA and other scientific institutions also continue updating their independent temperature datasets. Comparing multiple high-quality sources is one of the best ways for readers to avoid exaggerated claims or misleading interpretations.
Key Takeaways
The word “clima” can refer to climate or, in everyday usage, weather conditions in Spanish- and Portuguese-speaking contexts. Scientifically, however, climate refers to longer-term atmospheric patterns rather than a single day’s conditions.
The latest evidence shows a planet experiencing sustained warming. WMO confirmed that 2015–2025 were the 11 hottest years on record, while 2025 ranked as the second- or third-warmest year depending on the dataset.
Early 2026 observations continued to show unusually high global temperatures. January, February and March each ranked among the warmest versions of those months in the Copernicus record, even though regional conditions varied dramatically.
The ocean is another major warning signal. Record ocean heat, continuing glacier loss and persistently low sea-ice levels show that climate change extends far beyond the temperature people experience on land.
For individuals, the most useful lesson is to avoid judging long-term climate trends from a single weather event. Reliable climate information comes from long-term datasets, multiple indicators and scientifically reviewed analysis.
Conclusion
The latest climate story is not defined by one record-breaking afternoon or one unusual storm. It is the accumulation of evidence across years, oceans, ice sheets, atmosphere and ecosystems. From the 11 hottest years on record through 2025 to the unusually warm opening months of 2026, the data show a climate system undergoing significant long-term change.
Understanding “clima” therefore means looking beyond tomorrow’s forecast. It means recognizing the difference between weather and climate, following credible scientific measurements and understanding how global trends affect local communities. As climate monitoring becomes more sophisticated, reliable information will become even more valuable. Keep following verified climate data, regional forecasts and scientific updates to understand not just what the weather is doing today, but where the larger climate story is heading next.
Frequently Asked Questions
What does clima mean?
Clima” commonly translates to “climate” in Spanish and Portuguese. In everyday conversation, it can also be used when people are talking about local weather conditions.
Is clima the same as weather?
Ans: Not exactly. Weather describes short-term atmospheric conditions, while climate describes longer-term patterns and averages.
Is the world still warming in 2026?
Yes. Early 2026 data from Copernicus showed January, February and March all ranking among the warmest versions of those months globally, although none set a new monthly record.
What was the climate record in 2025?
WMO ranked 2025 as the second- or third-warmest year on record, with a global average temperature about 1.43°C above the 1850–1900 baseline in its March 2026 assessment.
Why can there be cold weather during global warming?
Climate change affects long-term averages and the wider climate system. Short-term weather patterns can still produce severe cold in particular regions, even while global temperatures remain elevated.
What are the biggest climate indicators to watch?
Global temperature, greenhouse-gas concentrations, ocean heat, sea level, glacier mass and polar sea ice are among the most important indicators monitored by climate scientists.
Can climate change still be limited?
The amount of future warming depends strongly on future greenhouse-gas emissions. Reducing emissions can limit additional warming, while adaptation can reduce the impacts of changes that are already occurring.